

It’s never been more important for education systems to demonstrate impact from their professional learning programs. The policy shift from test-based outcomes to more flexible, comprehensive success standards has brought new possibilities — and challenges — to every level of operations, and that includes professional learning.
Join KickUp as we examine six of the most common roadblocks to thriving data cultures. With practical tips, guiding questions, and real-life examples of districts excelling through data, you can push your professional learning program to new levels of effectiveness.
Most data issues can be traced back to either design or implementation. Let’s start at the very beginning: how you design data gathering.
TACKLING COMMON DATA ISSUES | PROBLEM 1
Data-driven improvement begins with clear, explicit alignment between what you plan to change (inputs) and the intended results of that change (outcomes).
Education researcher Joellen Killion’s “black box evaluation versus glass box evaluation” concept offers a clear metaphor for understanding the importance of this alignment in any successful program evaluation.
Let’s say we have a district-wide goal of raising student achievement in the literacy domain by 15%. We hypothesize that teachers using Cross-Curricular Literacy Training (CCLT) will become more equipped to support students’ literacy performance, so we implement CCLT coursework during summer professional development and throughout the year’s PD sessions.
In a “black box” program evaluation, the process looks something like this:
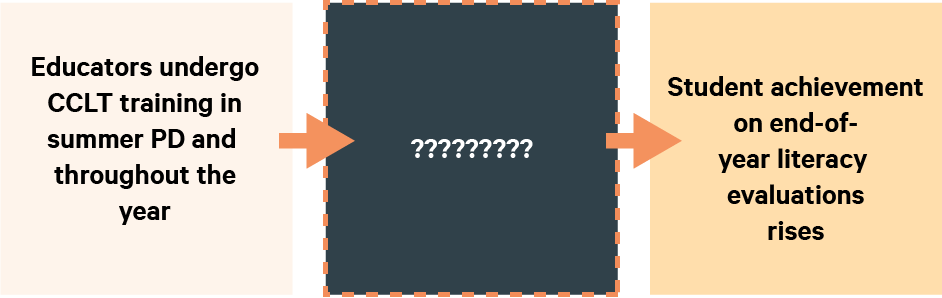
At the end of the year, the literacy evaluations scores have indeed risen — but not by enough to hit the district goal. It’s now time to plan for next year, but how do we know what to do differently?
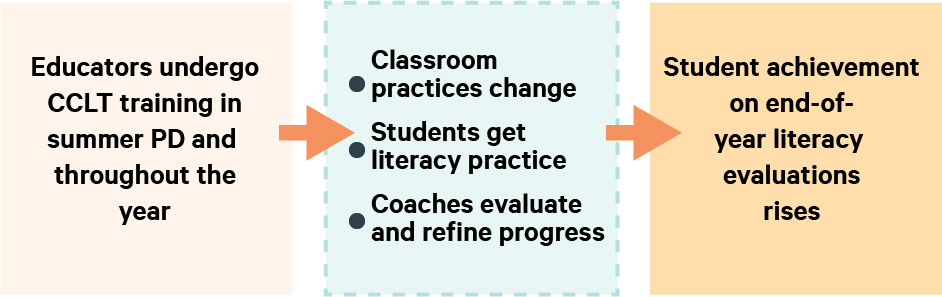
Joellen Killion’s “Glass Box” concept underscores the importance of understanding what comes between the inputs and the impact.
Formative data, Killion argues, is just as critical as summative. By studying the activities happening during the implementation of professional learning programs, we can not only capture leading indicators that tell us if we’re on the right path—we can understand the why behind our positive outcomes (or lack thereof).
A logic model is a graphical representation that outlines the relationships between the resources, activities, outcomes, and intended impact of your professional learning program. An effective logic model aligns the programming to the programming’s goals—which makes it the perfect outline for evaluation.
But what does “alignment” actually mean in this context? Two key factors:
Logic models bring planning, foresight and action together into a visual model of your program’s operations. They’re typically constructed before a program begins, providing an overview of the available resources, planned activities, predicted outcomes, and ultimate impact.
The William K. Kellogg Foundation says that a logic model “provides a road map of your program, highlighting how it is expected to work, what activities need to come before others, and how desired outcomes are achieved.” (See more at the WKKF Program Evaluation Handbook.)
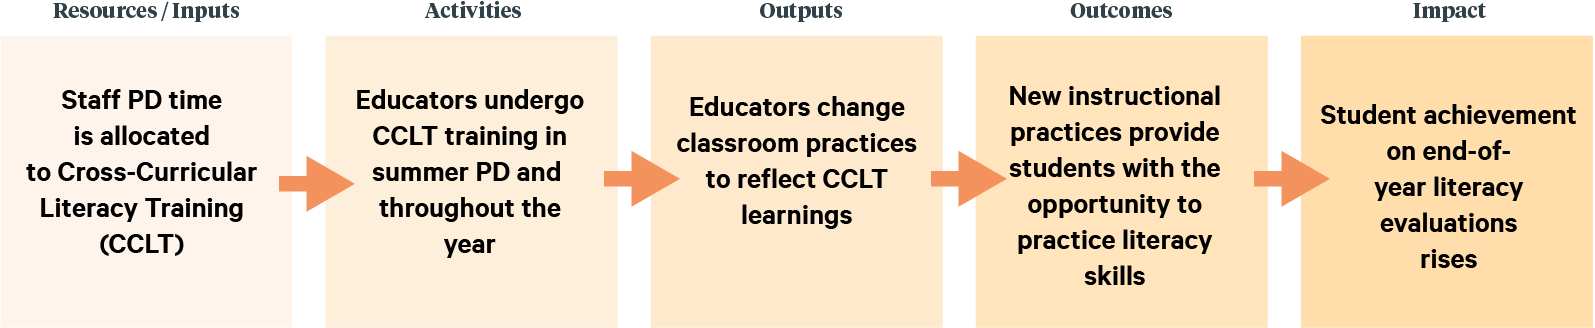
Logic model components can vary by organization, but usually break down into:
A logic model, then, becomes the perfect backbone for identifying precisely what practices are being changed and what data would indicate that change. So in the context of the literacy programming above, the model may look something like:
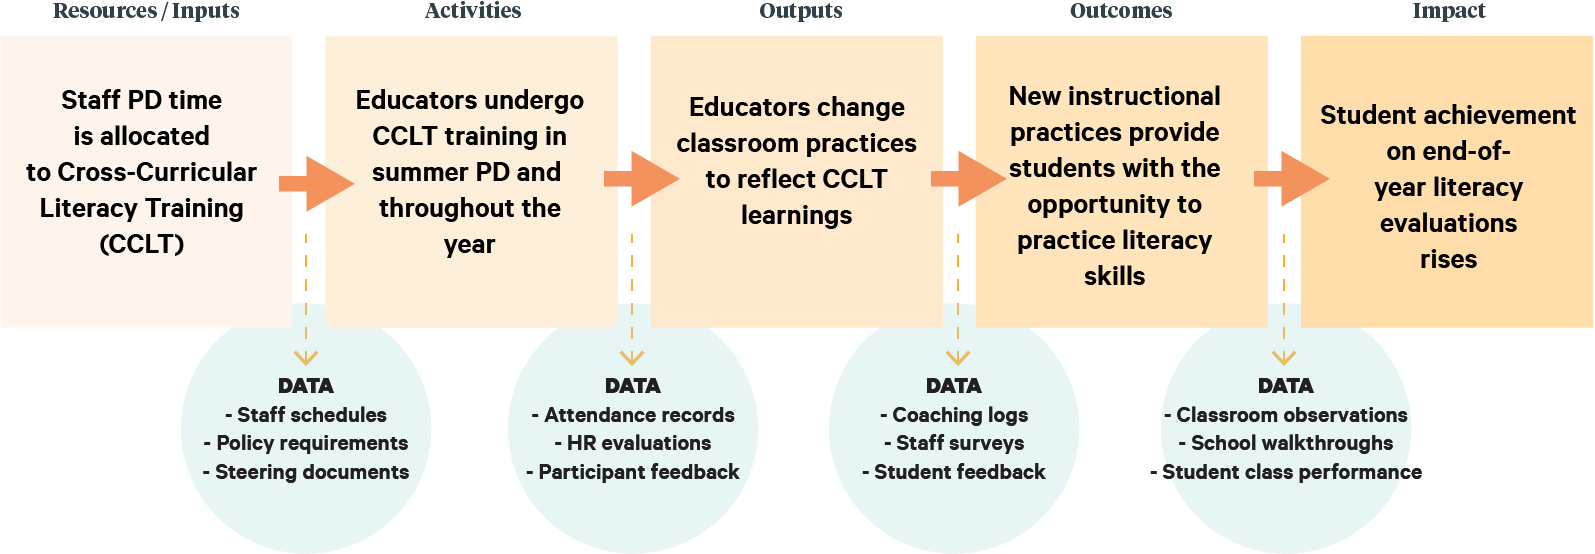
As we’ll explore further, those gold arrows are perfect opportunities for data check-ups. Confirming that Inputs are on the right track for effective Activities may mean simply verifying that the correct trainings are chosen and scheduled.
Between activities & outputs, you might collect post-PD feedback. Between outputs and outcomes, you do observations to ensure classroom practice is changing. Each piece of data is carefully connected to the precise change it indicates, and each of those changes is connected to the larger goal.
Now, as the program progresses throughout the year, the “black box” turns into a glass one — illuminated by the metrics and sources outlined in the logic model.
Schedule a demo with one of our friendly team members.


.png)