

It’s never been more important for education systems to demonstrate impact from their professional learning programs. The policy shift from test-based outcomes to more flexible, comprehensive success standards has brought new possibilities — and challenges — to every level of operations, and that includes professional learning.
Join KickUp as we examine six of the most common roadblocks to thriving data cultures. With practical tips, guiding questions, and real-life examples of districts excelling through data, you can push your professional learning program to new levels of effectiveness.
Timelines are tricky. Change doesn’t happen along predictable, linear paths: it comes in fits and starts. That’s not even to mention the fact that short, intermediate and long-term change can look very different in both pace and behavior. Today: how to build robust yet flexible calendars for data accountability.
TACKLING COMMON DATA ISSUES | PROBLEM 3
With all our emphasis on formative evaluation and regular check-ups, we can sometimes lose sight of the need for patience. Professional learning is a bit like gardening: initiatives need time to take root before you can start counting the leaves. But scattering seeds in the ground and walking away for a few weeks won’t work either.
When you plant a tomato seed, you’re looking for strong stems and healthy green leaves long before you can expect to catch a peek of any baby tomatoes. Understanding exactly what you’re looking for in and of itself is a part of the process. The key to planning collection timelines is understanding how the change you’re attempting to implement will play out in the context of your real-life schedule.
Let’s set aside the question of collection resources and school year calendars for the moment. You can adjust and realign your plan in later steps, but first, answer these questions as though you were living in the ideal world:
The answer to this question will vary depending on the type of PD implemented, the specific metric you’re working with, and the ultimate goal of your program. Defining short-, middle-, and long-term outcomes is a key part of any program development; the farthest-away prediction you can reasonably expect is your long-term outcome.
But the short- and middle-term outcomes aren’t miniaturized versions of the long-term ones. If you’re seeking to improve student achievement through increased instructional rigor, you may not see even modest gains in achievement for months as teachers learn to implement the new curriculum with fidelity.
During those months, instead, you should be looking for instructional outcomes — the healthy shoots and budding leaves that indicate your achievement tomatoes are on the way.
Bear in mind that depending on your program’s structure, these may break down in a few different ways: by affected party (educators, systems or students), by pure timeframe (your educators in one week, in one semester, in one year) or — our favorite — by KASAB level.
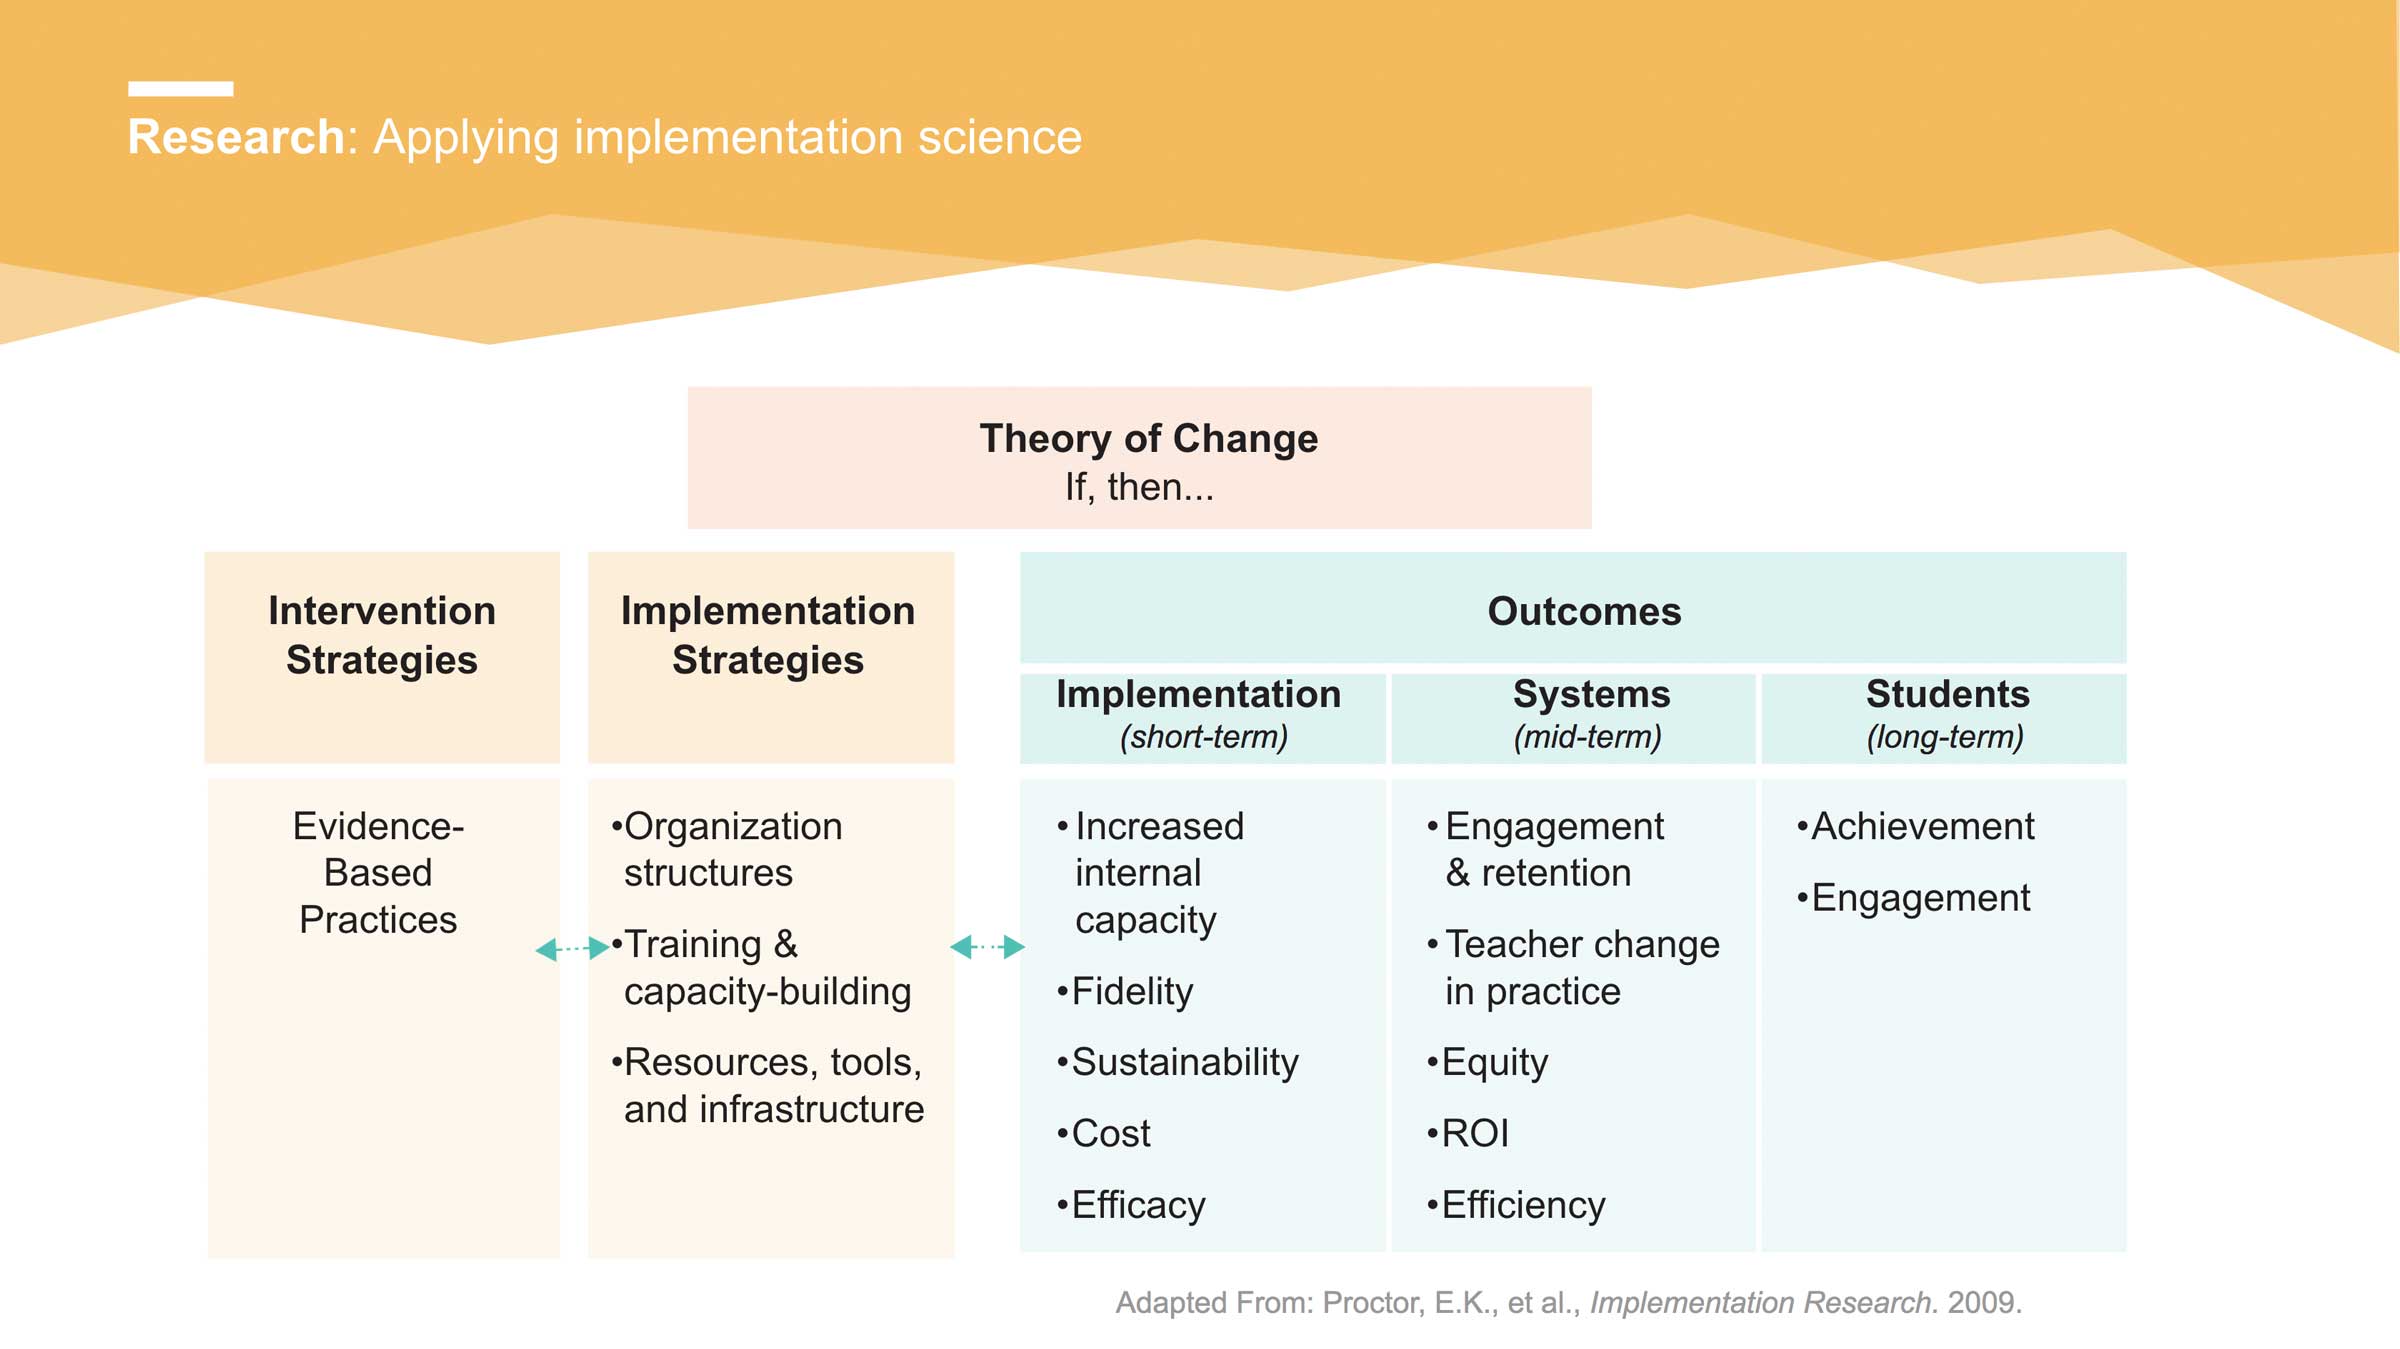
Above: One example of the stages of change, broken down by impacted audience.
Again, this is a prime opportunity to let the structure you’ve already defined in your KASABs provide guidance. Something like increased Knowledge or changed Attitudes can make themselves evident in as little as a day or a week — after a highly effective summer training, for example.
But while a good training can lay the groundwork for instructional shifts, sustained support and time is absolutely necessary for Skill-building, teachers’ ultimate Aspirations, and sustained Behavior change.
Therefore, you might consider building in more frequent (and ideally lower-effort) checks on the first two during the program’s initial stages, with a clear idea of the short- and mid-term outcomes in those areas. The trajectory indicated by those goals will help you determine the long-term outcomes you hope to see in the heftier, more resource-intense factors.
To measure and monitor PD impact, you’ll likely want to revisit the people it’s impacting — your teachers and coaches — multiple times.
For example, if you plan to assess the impact of a series of workshops on a new teaching method, you may want to plan for three or four separate touchpoints:
The type of data you’re seeking to collect will largely determine the type of survey instrument. Knowledge, attitudes and skills, for example, may be best determined via survey or self-assessment; activities and behaviors will probably be more accurately reported by observation.
You may also want to revisit the settings in which you collect data. Observing a setting multiple times lets you look for trends rather than one-off impressions. The greater the number of observations, the less likely it is that your conclusions are the “exception” instead of the “rule.”
Days of the week are a classic example of this dynamic: everybody knows that the feel of a classroom (or a whole school, for that matter) is different on a Monday during back-to-school season versus the Friday before a holiday weekend. To create a truly comprehensive assessment, spread walkthroughs across a variety of seasons and situations.
Sometimes, the real world sets our deadlines for us. Think about established decision-making opportunities that could be enhanced with data: district leadership meetings, 1:1s between principals and coaches, or critical board funding meetings. Including those deadlines onto your data collection calendar means that you can backwards-plan for its collection. Bear in mind that you’ll likely be coordinating multiple collections at once, so this kind of backwards map is absolutely critical to avoid overscheduling and allow room for flexibility and delays.
Once you have an idea of what needs to happen and when, it’s time to move from the ideal world to the real world.
The next step is to visualize that collection on the same calendar as your activities. Look for potential problem spots: are you scheduling a teacher survey for the same week as a district-wide holiday, setting yourself up for a weekend of frantic number-crunching? Best to move that collection up or down a week, even if it doesn’t precisely fit the “ideal-world” intervals you set up in the previous steps.
Visualizing like this can also illustrate opportunities in the schedule, like the opportunity to do site-based coach interviews at the same time as a school walkthrough.
ESC11’s Lone Star Literacy Initiative program uses a train-the-trainer model to improve literacy instruction in the Fort Worth area of Texas. During the year, ESC11 gathers data on teacher needs and student behaviors in order to understand and improve their ongoing supports:
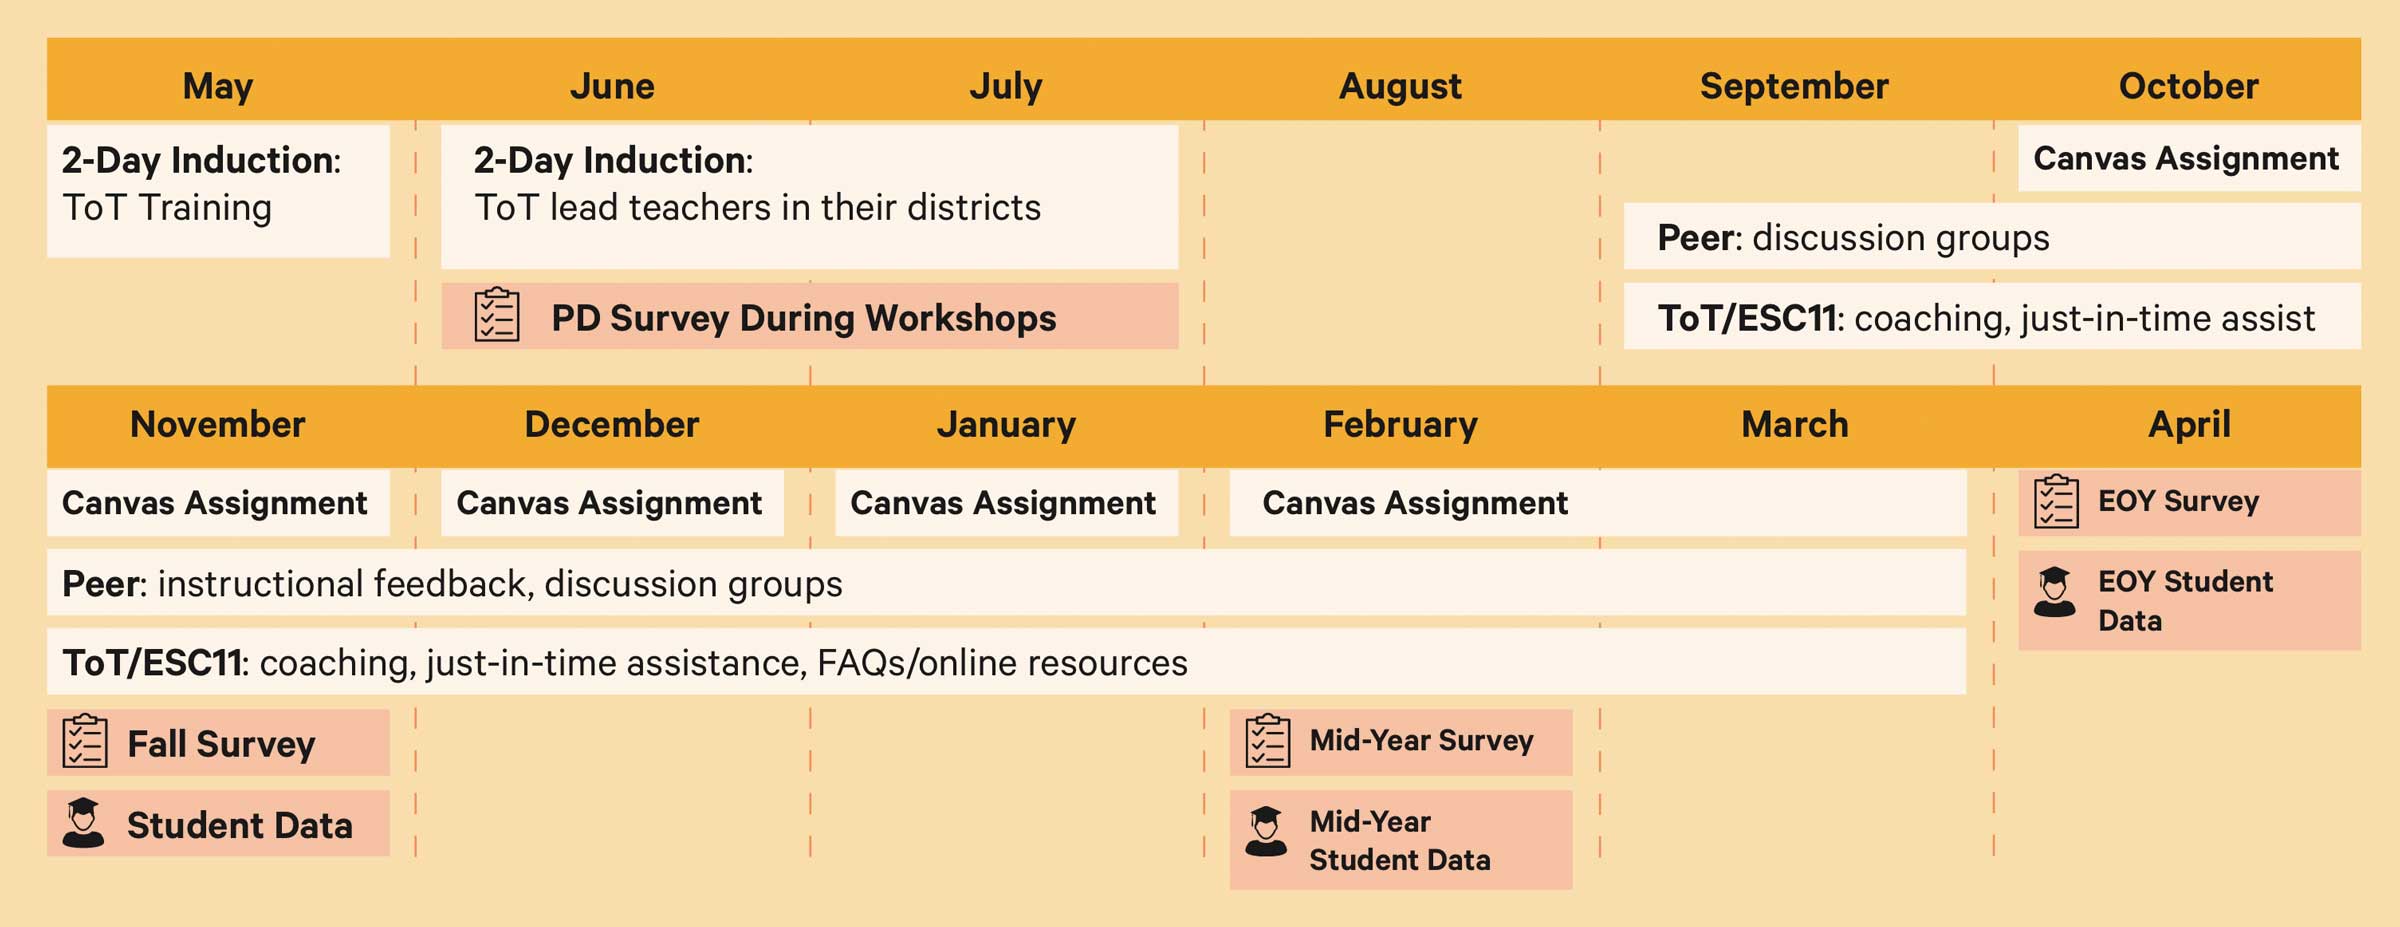
Note how ESC11 visualizes not just their data collection efforts, but the actual PD programs as well. During December and January they focus exclusively on short-term canvas assignments and long-term initiatives, making room for the busy holiday season. Surveys are timed to coincide with student data collection as well. The end result: a well-formatted calendar that makes the center’s entire year available at a glance.
Schedule a demo with one of our friendly team members.


.png)