

Once a hub of the American steel industry, Youngstown, OH is experiencing an unexpected Renaissance. After the twin blows of manufacturing shrinkage in the 1970’s and the Great Recession of 2008, the city has embraced its scrappy Rust Belt spirit with plans for economic diversification, a reduced but thriving populace, and exciting new developments for the public school system.
Perhaps the most surprising source of new economic development is tech venture capital straight from Silicon Valley. Homegrown startups stand side-by-side with firms transplanted from the West Coast, tempted by lower rents and Youngstown’s unique blend of old-school grit and contemporary development.
In the middle of all this, Youngstown City School District (YCSD) district operates 13 preschools, elementary, middle, and high schools across the city and surrounding Mahoning County. While the tech sector is promising big things for the city, persistent economic inequality still impacts its young learners. Nearly all (99.4%) of YCSD’s 5300 students are economically disadvantaged; 18.7% are students with disabilities, and 4.8% are English Language Learners.
Since 2010, Youngstown City School District has been in Academic Emergency based on failure to meet state minimum targets for academic performance. But while the district struggled with academic outcomes, 96% of its teachers were rated as “Skilled” or “Accomplished” on the most recent Ohio Teacher Evaluation System cycle — among the highest in the state.
“Youngstown is a district that had been in a constant struggle of achievement for over a decade,” says Gregory Kibler, YCSD’s Deputy Chief of Data. “And with that comes a lot of turnover—so basically, we’ve been in this state of new people and new programs without a strong foundation… and it wasn’t enough.”
YCSD administrators realized that to truly level out student outcomes, the adults in the system needed to get on the same page with instructional practice.
The district began pushing for more frequent and actionable touchpoints with the goal of uncovering hidden issues, shifting instructional practice, and creating a culture of efficiency-driven excellence. But the new emphasis on evaluation brought its own problems, with classroom observers feeling overworked and teachers feeling micromanaged.
“Going ‘Here’s some professional development and we expect you to go do it the way we taught you the first time’ isn’t realistic. We really need to monitor what’s going on in our classrooms so we can continue to support teachers. For us, it was just good foundational practices,” said Kibler.

With the input of parents, community members, School Board leaders, and district officials, YCSD adopted a Gradual Release of Responsibility Framework: a set of instructional practices designed to give teachers the autonomy they needed while:
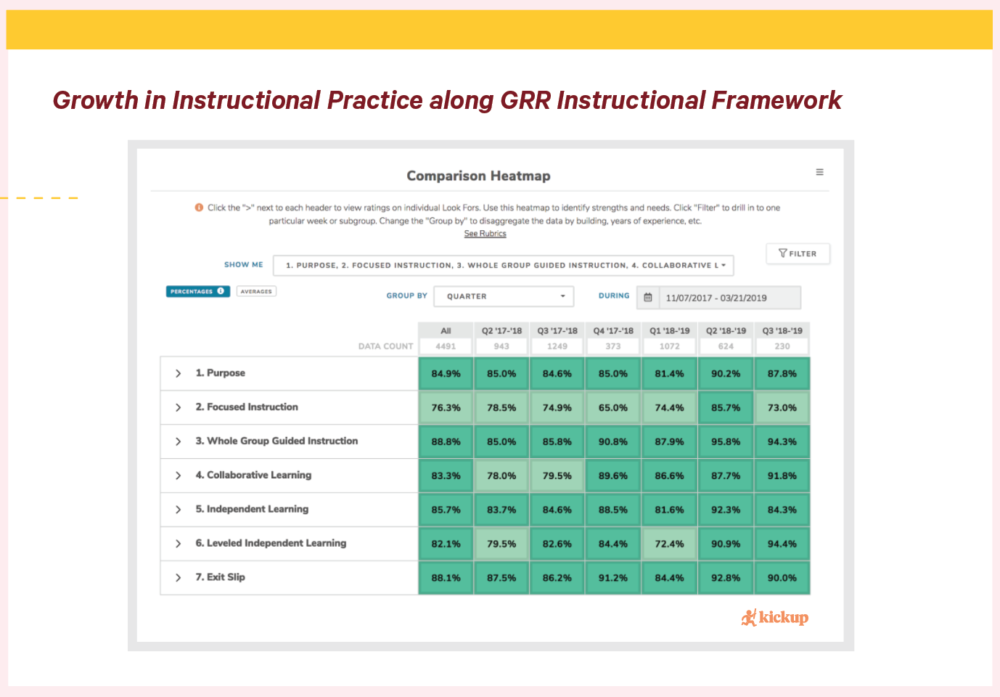
Non-evaluative walkthroughs are a critical part of Youngstown’s instructional cycles. YCSD believes that frequent, high-quality feedback will shape instruction, inform ongoing supports, and improve student learning. Beginning in September of 2017 and running through the 2018-19 school year, staff and administration received training on GRR calibration.
The new focus on actionable data allowed YCSD to align real-time interventions precisely in accordance with what would most benefit teachers. For example, after noticing differences between observer scores, YCSD led a workshop using recorded classroom observations to help observer teams synchronize their reports with the rubric:

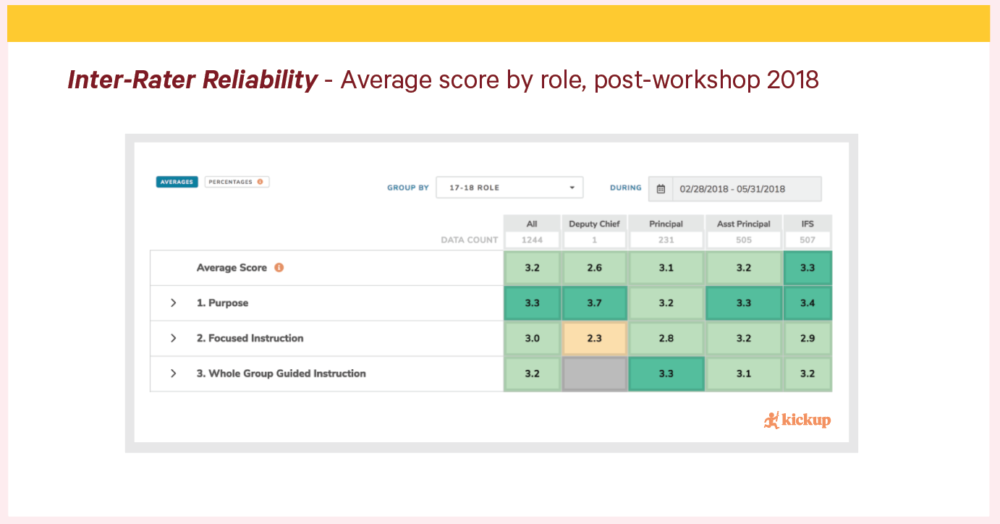
(Click here to see Greg talk more about YCSD’s inter-rater alignment strategies)
YCSD then spent the following month focused on improving the “bite-sized action step” feedback shared with each educator to ensure it was actionable. Instructional coaches reserved time with building principals to review walkthrough data and align instructor supports. As a result, the district now has more reliable data and team buy-in across district leadership.
“Our data review process evolved from directive to collaborative, or from punitive to supportive,” says Kibler. “Bringing educator cohorts together to go over their own data… was integral to helping our teachers self-solve common problems and drive student learning.”
And bigger and better things are still to come. After the GRR pilot’s conclusion in summer 2019, the district is now folding in PBIS and literacy evaluation structures into their existing framework. These new structures are designed to illuminate trends in outcome data, such as discipline incidents by time of day, and suggest causes and next steps. Evaluators have also relaxed the schedule of their walkthroughs to make space for less frequent but more thorough feedback.
“It’s been a dramatic and amazing shift,” says Kibler. “We’re moving from ‘getting things done’ to ‘making things effective.”
In the Classroom
A Focus on Equity
Reading
Math
After a year of implementation, Deputy Chief of Data Greg Kibler offered the following three reflections:
Having a rubric is not enough
This was a critical reflection point for principals. While observation walkthrough data was helping to shape instruction, good planning translate to results for students. The triangulation and reflection on these data elements allowed leaders to determine the feedback teachers needed to see the most growth in students.
We needed to empower those who had the data to use it.
Our data review process evolved from directive to collaborative by creating colleague cohorts meeting together to solve common problems seen in their data.
We needed to triangulate data to get a fuller, more actionable view.
During Teacher Quality Reviews, we linked teacher implementation data and observations with student data to determine how effective teachers are and what supports they needed.
Image courtesy of Youngstown City School District and the D5 Group (photographer DeShawn Scott).
Schedule a demo with one of our friendly team members.

.png)